
Oil sands facility-level operational finance modelling by Rory Johnston, Commodity Context
INTRODUCTION AND KEY FINDINGS
The May 2026 federal-Alberta implementation agreement commits to industrial decarbonization while boosting Western Canadian energy exports.
This paper examines the impact of two critical provisions in the agreement on Alberta’s oil sands industry: raising the minimum effective carbon credit price to C$130 per tonne and adding new bitumen pipeline capacity. We assess the net profitability effect of these increased carbon costs and the future value of increased export capacity for four representative oil sands projects.
Public revenues from the oil sands depend on the price of the Western Canadian Select (WCS) crude blend. Public revenues increase with producer profitability, because mature oil sands facilities pay royalties based on their net profits.
WCS crude trades at a discount to the benchmark West Texas Intermediate (WTI) blend due to its inferior quality and the cost of transporting it to market. Egress capacity from the landlocked Western Canadian Sedimentary Basin is historically the largest and most volatile driver of the WCS-WTI price differential. New pipeline capacity that avoids the need to ship oil sands crude via more expensive rail could reduce the price differential by US$5 per barrel over the long term. This would increase revenues and profitability for oil sands facilities.
The oil sands sector accounts for about a third of Alberta’s total greenhouse gas emissions, making it the highest-emitting sector in the province. Like other large emitters, oil sands facilities are regulated under the province’s carbon pricing system, the Technology Innovation and Emissions Reduction (TIER) regulation.
This paper looks at the impact of federal-Alberta memorandum of understanding (MOU) implementation agreement on the profitability of four facilities that together account for one-quarter of total oil sands bitumen output. The facilities have a range of emissions intensities. Cenovus Energy’s Christina Lake facility and Imperial Oil’s Kearl mine are best in class, Suncor Energy’s Firebag facility has a mid-range emissions intensity, and Imperial’s Cold Lake is one of the most emissions-intensive facilities in the province.
This paper, originally published in March 2026, found that the benefits of increased pipeline capacity outweigh the increase in carbon costs agreed in the MOU. The modelling done then assumed a carbon credit price of C$130 per tonne by 2035.
Since then, the Government of Canada and Government of Alberta signed their implementation agreement, which aims to meet a credit price of C$130 per tonne by 2040. The resulting costs to these oil sands facilities will therefore actually be lower than we assumed in our models, and their profitability, when additional pipeline capacity comes online, will be even more substantial than is reported here.
Key findings
1. The benefits of increased pipeline capacity outweigh the increase in carbon costs agreed in the MOU. When new pipeline capacity comes online, the resulting sustained reduction in the WCS-WTI differential increases per-barrel profitability for the facilities we analyzed by 30 per cent to 91 per cent, net of carbon costs.
Carbon costs at these facilities would increase from between C$0.53 and C$2.46 per barrel to between C$0.81 and C$3.75 per barrel at the time that new pipeline capacity is likely to come online, relative to a scenario where Alberta kept its industrial carbon price frozen at C$95 per tonne. But these cost increases are far outweighed by an increase in profitability of more than C$10 per barrel at all the facilities we analyzed, resulting from the reduction in the WCS-WTI differential.
2. The increase in profitability from new pipeline capacity will allow most oil sands facilities to quickly recoup all their additional carbon costs. The increase in profitability from a new pipeline is significant: three of the four facilities analyzed recoup all their additional interim TIER costs (between now and the opening of the pipeline) within one year of the pipeline beginning operations. This is driven primarily by the resulting reduction in the WCS-WTI differential.
3. New pipeline capacity significantly increases both net profits for oil sands facilities and provincial royalty revenue. For the four facilities we analyzed, new pipeline capacity increases per-barrel profitability and allows facilities to increase production. This results in a C$3.16 billion nominal increase in annual profits in the 15 years following the opening of new pipeline capacity that reduces the WCS-WTI differential, and a C$957 million annual increase in provincial royalties.
SUMMARY OF RESULTS
This analysis asks whether the costs of increased carbon credit prices for oil sands producers in Alberta’s carbon market outweigh the benefits of increased pipeline capacity, specifically the avoidance of structurally wider WCS-WTI price differentials. A new pipeline that can transport an additional one million barrels per day will allow Canadian producers to avoid shipping bitumen by more expensive rail transportation. Shipping oil by rail has historically cost US$5 more per barrel than pipeline transport. New pipeline capacity that prevents additional use of rail should result in higher profitability for companies.
We look at four major oil sands projects at different points on the spectrum of emissions costs to evaluate the potential impact of increased credit prices under Alberta’s Technology, Innovation and Emissions Reduction (TIER) system on profitability. We find that for low-emissions facilities, the increase in profit from a lower WCS-WTI differential vastly outweighs the costs from TIER credits increasing to C$130 per tonne.
New pipeline capacity will likely take another six to 10 years to build, given construction timelines. Nevertheless, we find that once this new capacity comes online it will boost profitability enough to enable low-emitting oil sands facilities to quickly recoup all the additional carbon costs they incur between now and pipeline commissioning.
Even for the oil sands facilities that face the highest costs under TIER — those that are both high-emitting and have seen their emissions increase in recent years — the increase in profitability from a new pipeline still outweighs likely 2035 carbon costs. However, facilities with higher emissions intensities than in the past, or with emissions intensities considerably above best-in-class facilities, face a significantly longer payback period.
Improved facility-level profitability will drive a considerable increase in the royalties collected by Alberta and corporate income taxes paid to the Alberta and federal governments.
We analyze four large oil sands facilities: Cenovus Energy’s Christina Lake facility, Imperial Oil’s Kearl mine, Imperial’s Cold Lake facility, and Suncor Energy’s Firebag facility. Together, these facilities account for roughly one-quarter of total oil sands bitumen output. These four projects span a range of emissions intensities, from best-in-class at Christina Lake and Kearl, to mid-range performance at Firebag, to one of the most emissions-intensive facilities in the province at Cold Lake.
None of these projects are forecasted to generate carbon credits in 2035. Our analysis seeks to show the profitability impact of new pipeline capacity and increased TIER carbon costs for facilities that are most likely to bear compliance or decarbonization costs. Many oil sands facilities[1] are credit generators and may remain so over the next decade.[2]
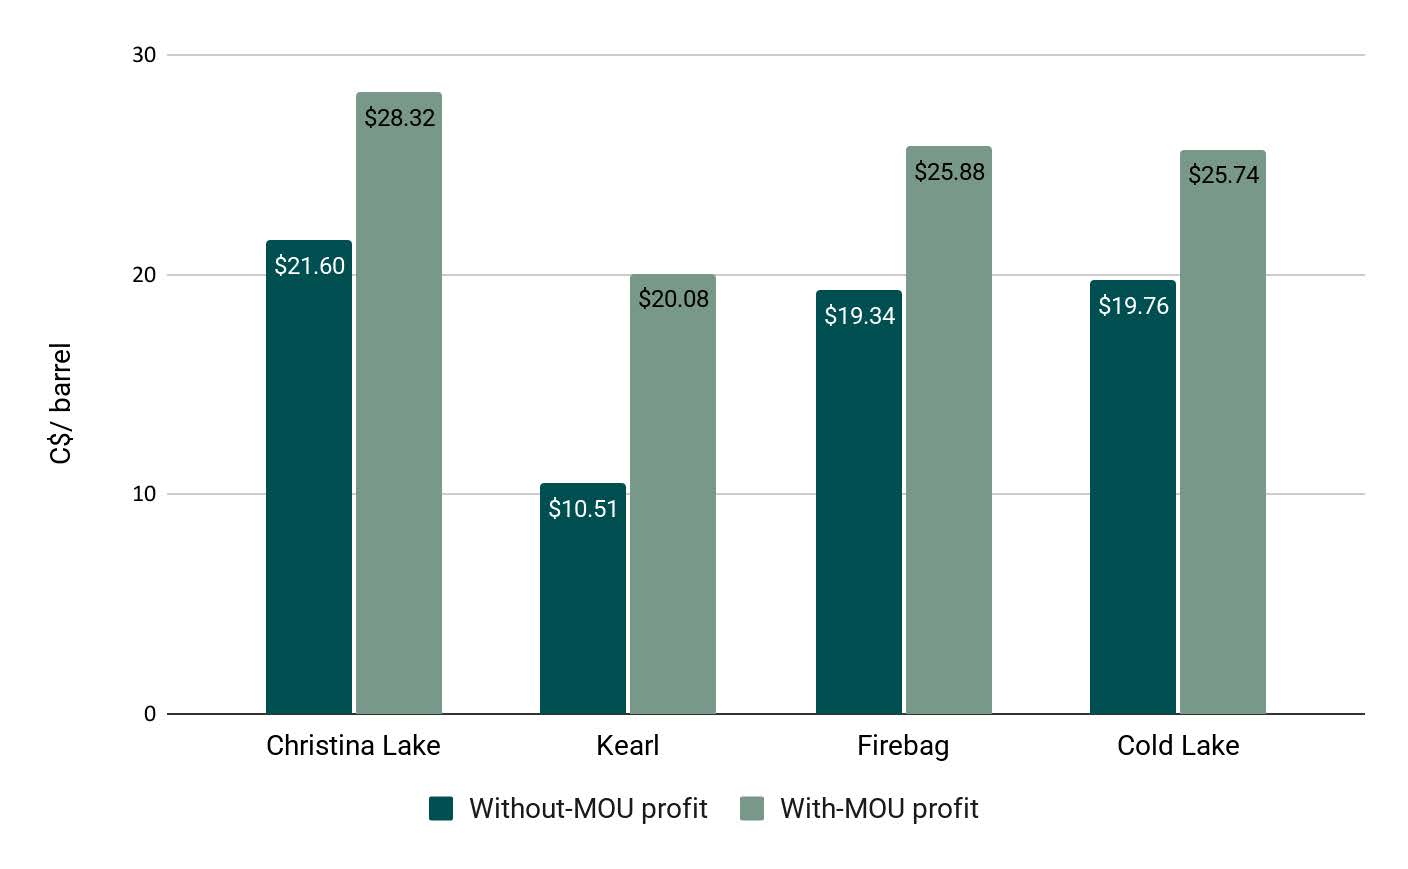
Figure 1 (below) shows the net change in per-barrel profits at each facility in 2035 as a result of realizing the MOU’s commitments to build significant new pipeline capacity and achieve a minimum effective TIER credit price of C$130 per tonne. These findings assume that TIER credit prices increase at a rate of C$5 per year beginning in 2026. The findings also assume a WTI price of US$65 per barrel and a reduction in the WCS-WTI differential from US$18 to US$13 per barrel. The findings are discussed in greater detail below.
Figure 1: Profitability growth across four representative oil sands projects
KEY CONSIDERATIONS IN OIL INDUSTRY ECONOMICS AND EMISSIONS POLICY
If the Western Canadian oil industry gains access to greater egress capacity, this can help minimize the WCS-WTI price differential. The WCS differential is set by the marginal barrel, meaning the final barrel to clear the market. The price of the marginal barrel sets the price for all barrels produced in the Western Canada Sedimentary Basin (WCSB). Even modest shortfalls of egress capacity can spiral into acute crises in upstream pricing.
At the same time, future pipeline projects — including new pipelines and pipeline expansions — should be carefully structured to ensure that they contribute to reducing the WCS-WTI differential. The Trans Mountain Expansion Project highlighted the risk that runaway pipeline construction costs can lead to high tolls that increase marginal barrel prices.
There are considerations involved in pipeline and upstream capacity expansion that go beyond what we consider here. For example, increased production to fill expanded pipeline capacity may require developing lower-margin projects. A lower WCS-WTI differential affects project economics differently than company-wide profitability; some companies will have hedging or refining strategies that mitigate these concerns. Increased pipeline capacity to the U.S. may reduce the need for additional West Coast egress. Our analysis considers the potential value of a new pipeline that shrinks potential future WCS-WTI price differentials.
There are also global trends that will determine the general appetite for investment in Canada, and our analysis is neutral on the overall competitiveness of Canada’s investability relative to competitors. For example, overall cost competitiveness, permitting approval speeds, regulatory costs, additional government policies, and the risk profile of Canada’s oil reserves will influence the interest of global capital in Canadian investment. Global oil prices will also influence investment decisions. Our analysis asks how the implementation of the federal-Alberta MOU could impact oil sands profitability.
Transportation differentials
If insufficient pipeline capacity shifts the marginal transportation of WCS crude to more expensive rail, the total WCS-WTI price differential in Hardisty, Alberta, can increase to US$18 per barrel.
In cases of extreme oversupply, transport costs can push the differential past US$18 per barrel, until producers are forced to shut in production or the provincial government imposes curtailment. Under current conditions our analysis assumes a stable, if economically sub-optimal, WCS-WTI differential of US$18 per barrel. We project that a new million-barrel-per-day pipeline would allow for expansion of oil sands production without extensive crude-by-rail shipments, thereby reducing the price differential. An analysis[3] of the Trans Mountain Pipeline Expansion found that it reduced the WCS-WTI differential by about US$8/barrel. Although that analysis argues that a new pipeline would not reduce differentials further, additional expansion of oil sands production would likely put renewed pressure on differentials that only new pipeline access would alleviate.
Figure 2: WCS-WTI differentials and transport break-even points

Tolls
Marginal pipeline tolls are the primary driver of the geographic price differential for WCS and bitumen. Tolls are critical not just for the project economics of a pipeline but for the economics of the entire WCSB upstream oil industry. The Canada Energy Regulator sets tolls on interprovincial pipelines based, typically, on both the cost of construction and operation and as some regulated rate of return. Toll rates have been impacted by the ballooning costs of pipeline construction. Most recently the 590,000 barrel Trans Mountain Expansion Project saw its price tag spiral from an initial cost of C$5.4 billion to approximately C$35 billion by the time it entered service.
The current uncommitted toll to ship a barrel of heavy crude from Edmonton to the Westridge Terminal at the Port of Vancouver via the Trans Mountain pipeline is C$14.40 per barrel, which is more than twice the C$6.60 per barrel cost to ship from Edmonton to Flanagan, Illinois, on the Enbridge Mainline. Once at the Westridge Terminal, Canadian barrels still need to price in tanker transportation to the end destination; transportation to China is an additional US$3 or more per barrel, for example.
Moreover, 80 per cent of the current Trans Mountain system’s flow is committed barrels on take-or-pay contracts, which has initially shielded basin-wide pressure on marginal prices. Take-or-pay capacity will be used first, meaning that these higher tolls don’t weigh on marginal pricing. However, the economics of shipping on the expanded Trans Mountain system will, undoubtedly, start to put additional widening pressure on the WCS differential once the approximately 180,000-barrel uncommitted portion of the system is required to clear the basin, because it will then be the higher tolls determining marginal egress costs.
The federal-Alberta MOU stipulates that new bitumen pipeline capacity will be privately built and financed. Tolls would need to cover the cost of construction plus a rate of return commensurate with the high risk of pursuing the project, given that similar projects have faced delays, cost overruns, and cancellations. A toll set as high or higher than Trans Mountain’s uncommitted rate would likely increase the WCS-WTI differential, thereby devaluing all barrels produced in the basin and eroding the value of incremental takeaway capacity. Our analysis assumes that the tolls charged by a new pipeline would not systematically increase the WCS-WTI differential.
Royalties
Royalties are the most direct financial stake that Albertans have in the value received for bitumen produced from the oil sands. Over the past half-decade, royalties have ballooned due to a combination of higher oil prices, healthier WCS differentials thanks to increases in pipeline capacity, and projects being required to pay higher royalty rates as they recoup their capital costs. Oil sands royalties have soared to more than C$17 billion in 2025 from C$950 million in 2006.
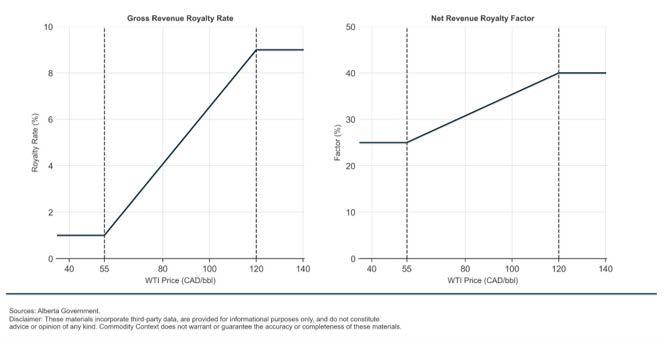
Oil sands projects that haven’t recovered their capital costs are said to be “pre-payout,” and pay royalties at a rate of 1per cent of gross revenues at WTI prices up to C$55 per barrel. Their royalties increase to a maximum of 9 per cent of gross revenue as WTI prices rise to C$120 per barrel. A “post-payout” project has recovered its capital costs and pays the greater of either the pre-payout royalty calculation, or between 25 per cent and 40 per cent of net revenues, again increasing as the price of WTI crude increases from C$55 per barrel to C$120 per barrel (see Figure 3).
A long-established and highly profitable facility such as Cenovus Energy’s Christina Lake is now in the post-payout royalty period, while the more recent Imperial Oil Kearl oil sands mine, which incurred a very large upfront capital cost, is still recouping its initial investment and is in the pre-payout period.
In recent years many oil sands projects have shifted to post-payout status, driving the Alberta royalty windfall that began in 2022. As a result, Alberta’s fiscal sensitivity to changes in crude prices and WCS differentials is much higher today than during the egress crisis of 2018. Albertans benefit relatively more from price increases for post-payout projects and, on the flip side, face larger declines in public revenues as oil prices fall or WCS-WTI differentials widen. The impact of an increase in the WCS-WTI differential on the royalties paid by a profitable post-payout project is much larger in absolute terms than the impact would have been on the same project during its pre-payout period, when it paid a much lower royalty rate.[4]
Figure 3: Alberta oil sands royalty rates
Emissions from Alberta’s oil sands
The oil sands sector accounted for just less than 33 per cent of Alberta’s total emissions[5] in 2023, making it the highest-emitting sector in the province. In Alberta, emissions from the oil sands and other large industrial sources are regulated through a combination of provincial carbon pricing and emissions-management policies, such as methane regulations. This analysis focuses on the impact of the TIER regulation, which applies to high-emitting facilities. Under TIER, regulated companies must meet emissions benchmarks. They can reduce emissions directly, use approved credits for reductions, or pay into a provincial fund if they exceed their targets.
Under TIER, large industrial facilities — including many in the oil sands — are given an annual emissions target based on a benchmark. The benchmark defines how much a facility is allowed to emit per unit of production. Oil sands producers can choose between two benchmarks. The first option is a facility-specific benchmark (FSB), based on that facility’s own historical performance. This benchmark requires the facility to emit less per unit of production compared with its own past performance. The second option is the high-performance benchmark (HPB), based on the average emissions intensity of the top-performing 10 per cent of facilities in a given sector for a particular product. This flexibility prevents facilities with low emissions intensity from being penalized by TIER’s standard facility-specific benchmarking method.
Figure 4 (below) compares the estimated facility-specific benchmarks and 2023 emissions intensities across oil sands facilities using 2023 data, illustrating the impact of this approach and the differences in emissions intensity across projects. Notably, FSBs are substantially higher for facilities with greater emissions intensity.
Figure 4: Estimated 2023 emissions intensity and facility-specific benchmarks for oil sands facilities under TIER[6]

Estimating emissions from oil sands facilities
The four oil sands facilities we analyze represent a range of emissions intensities. Other facilities with similar emissions intensities should see similar impacts on their profitability from the implementation of the MOU. We analyze two projects with relatively low emissions intensities (Christina Lake and Kearl), one with an average emissions intensity (Firebag), and one that is on the higher end (Cold Lake) and faces high compliance costs in relation to its facility-specific benchmark. A metric called production weighted average emissions intensity (PWAEI) in Figure 6 puts the projects’ emissions performance in perspective by weighting each facility according to output.
These project-specific emissions intensity differences necessitate project-specific analysis of carbon costs. We sourced historical oil sands data from the Government of Alberta’s Alberta Oil Sands Greenhouse Gas Emission Intensity Analysis.[7] The dataset includes the following data for in-situ oil sands and mined oil sands projects from 2011 to 2023: monthly and annual production volumes, emissions, cogeneration emissions, heat and electricity generation (as applicable), cogeneration adjusted emissions, and cogeneration adjusted emissions intensity.
We compiled historical data from 2013 to 2023 for Cenovus Energy’s Christina Lake facility, Suncor’s Firebag facility, Imperial Oil’s Kearl mine, and Imperial’s Cold Lake facility.[8] We forecast facility data for the years 2024 to 2035. We assume production increases by 2.7 per cent annually and produce forecasts for cogen adjusted emissions intensity, cogen heat, and cogen electricity.[9] We assume that emissions intensities decline at a conservative rate of 0.5 per cent annually.[10]
To estimate costs under TIER for each project, we compare the costs under an FSB and the HPB.[11]
We chose the lesser of the two costs for each facility. We also assume that companies maximize the credit usage limit at the forecasted credit price. Finally, companies can deduct their TIER costs from post-payout net-revenue royalties. We assume an estimated average post-payout royalty rate of 33 per cent.
These are conservative estimates of carbon costs. Costs could be lower as projects make low-carbon investments over the next decade. We also do not account for credit generation that could result from significant emissions reduction projects in the sector, such as the Oil Sands Alliance’s Pathways carbon capture project.
These estimates also do not incorporate the potential impact of the Pathways project on emission reductions. Companies that are not participating in the project would have unchanged costs, continuing to comply with carbon pricing at market credit prices. Participating companies would likely face lower carbon costs, optimizing carbon credit use across their portfolios. See Box 1 below for more details on how the Pathways project could impact the profitability of participating companies.
RESULTS: PROFITABILITY GROWTH FROM A PIPELINE OUTWEIGHS CARBON COSTS
Project-specific analysis [12]
Using Commodity Context’s financial model of Alberta oil sands operations, which includes facility-level royalty data, we estimate the future gross revenue, production, costs, royalties, and net operating cost of our four oil sands facilities. We assume that each facility sees annual production growth of 2.7 per cent. Such growth is consistent with the MOU’s commitment to build additional pipeline capacity of at least one million barrels per day to Canada’s West Coast. To ascertain the increase in profitability, we assume that a new pipeline reduces the WCS-WTI differential from US$18 per barrel to US$13 per barrel.
In our figures below, “without-MOU profit” represents profitability in 2035 under a status quo scenario — Alberta carbon pricing still frozen at its current rate of C$95 per tonne, no major new pipeline capacity, and therefore a WCS-WTI differential of US$18 per barrel. In contrast, “with-MOU profit” represents a scenario where implementation of the MOU provisions leads to the construction of new pipeline capacity, and the price of TIER carbon credits rises to C$130 per tonne by 2035.
This paper was originally published in March 2026, before the Government of Canada and Government of Alberta signed the implementation agreement. The agreement signed in May 2026 has TIER carbon credits rising to C$130 by 2040.
The resulting costs to these oil sands facilities will therefore actually be lower than we assumed in our models, and their profitability, when additional pipeline capacity comes online, will be even more substantial than is reported here.
A US$1 per barrel change in the WCS differential has a magnified effect on underlying bitumen values. A barrel of WCS is about two-thirds bitumen and one-third diluent, which oil sands producers must purchase or produce elsewhere. If diluent prices remain constant while WCS prices change, the bitumen component of a WCS barrel must absorb 100 per cent of that price fluctuation. The value of bitumen increases or decreases by about US$1.50 per barrel for every US$1 per barrel change in the WCS-WTI differential.
Christina Lake
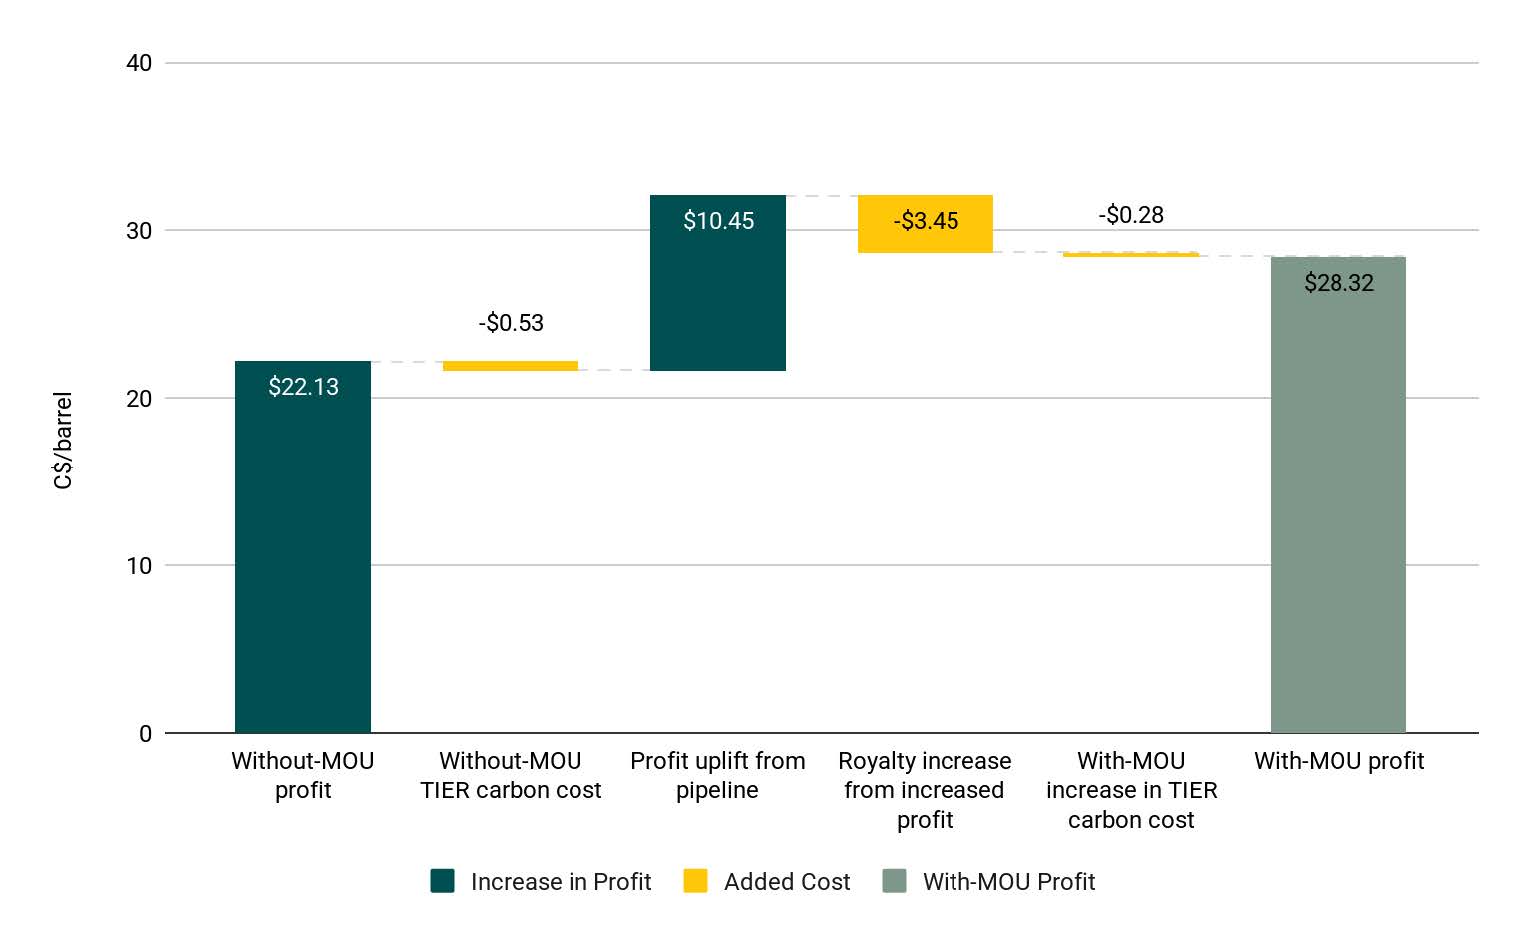
The addition of new pipeline capacity envisaged in the MOU results in a meaningful improvement in profitability for Christina Lake by 2035, even after accounting for higher royalties and carbon compliance costs. Without the MOU, profit is C$21.60 per barrel, including TIER carbon costs of C$0.53 per barrel. Following implementation of the MOU, improved pipeline access delivers a large impact, increasing profitability by 31 per cent (C$6.72 per barrel) as tighter WCS-WTI price differentials strengthen realized bitumen pricing. This upside is partially offset by a C$3.45 per barrel increase in royalties as higher WCS prices and net revenues increase the project’s royalty rate, along with a C$0.28 per barrel increase in TIER carbon costs at a C$130 per tonne carbon credit price. Overall, profit rises to C$28.32 per barrel, demonstrating that improved market access more than compensates for increased carbon costs.
Additional pipeline capacity not only increases per-barrel profits but also increases total profits and royalties. Net profit increases by about C$473 million in 2035 alone, relative to a scenario with no new pipeline capacity.
Figure 5: Increased profitability of Cenovus Energy’s Christina Lake facility in 2035 following implementation of federal-Alberta MOU[13]
Kearl
New pipeline capacity that holds the WCS-WTI differential at C$13 per barrel in 2035 also delivers a substantial uplift in profitability for a project like the Kearl mine. Without the MOU, profit is C$10.51 per barrel, including TIER carbon costs of C$0.65 per barrel.[14] Under the MOU, additional pipeline capacity adds a significant C$9.56 per barrel, nearly doubling baseline margins, inclusive of a C$0.55 per barrel increase in royalties and a C$0.34 per barrel increase in TIER carbon costs.
We project that Kearl will still be in its pre-payout period in 2035, meaning that revenue increases will have a more muted effect on the increase in royalties until the project recoups its investment. Additionally, as a mine it has lower operating margins. As a result, any increase in revenue from reductions in WCS-WTI differentials has a disproportionately higher impact on its profit growth, compared to older, post-payout facilities with higher margins. Although outside the scope of this analysis, it’s also worth noting that higher profits will accelerate Kearl’s transition to a post-payout royalty regime, resulting in higher fiscal returns for the province.
Overall, implementation of the MOU increases profitability to C$20.08 per barrel, roughly a 91 per cent improvement versus the without-MOU scenario of widening WCS-WTI price differentials. This highlights how enhanced market access is particularly transformative for lower-margin projects like Kearl.
Figure 6: Increased profitability of Imperial Oil’s Kearl mine in 2035 following implementation of federal-Alberta MOU

Firebag
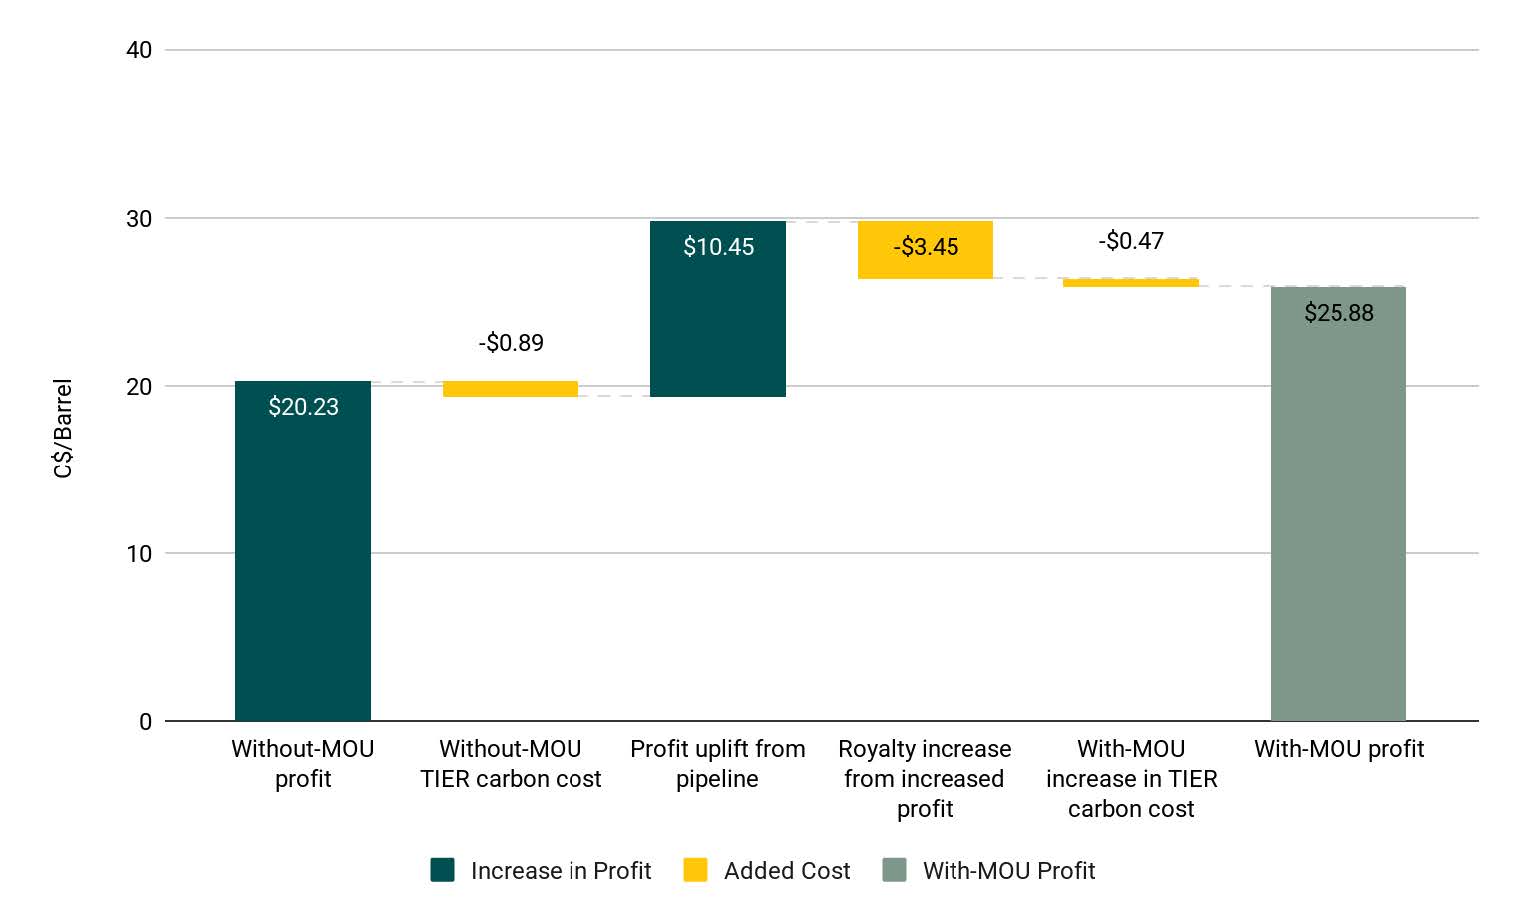
For Suncor’s Firebag facility in 2035, additional pipeline capacity added under the terms of the MOU produces a solid improvement in profitability, with gains clearly outweighing incremental carbon costs, albeit not as much as for Cenovus’ Christina Lake or Imperial’s Kearl mine. Without-MOU profit starts at C$19.34 per barrel, partially reduced by C$0.89 per barrel in TIER carbon costs. Improved pipeline access delivers a 34 per cent increase in profitability (C$6.54 per barrel), reflecting stronger revenues from tighter WCS-WTI differentials. This upside is partially offset by a C$3.45 per barrel increase in royalties due to higher WCS prices and higher profits, along with a C$0.47 per barrel increase in TIER carbon costs. Overall, profitability rises to C$25.88 per barrel, demonstrating that for facilities with stable historical emissions intensities that can achieve reductions relative to their facility-specific benchmarks, improved market access remains a meaningful driver of long-term margin expansion, despite rising carbon costs.
Figure 7: Increased profitability of Suncor’s Firebag facility in 2035 following implementation of federal-Alberta MOU
|
Box 1: Impact of the Pathways project on profitability The Oil Sands Alliance’s Pathways project[15] is a large-scale carbon capture, transport, and storage project in Alberta’s oil sands. Phase 1 is a C$20-billion system proposed to capture up to 12 MtCO2 per year from oil sands facilities. Our analysis elsewhere in the report does not consider the potential impact of participation in the Pathways project on the profitability of our four oil sands facilities, as the exact cost of the project will differ for each facility. All four facilities are planned to participate in Pathways. Construction of the Pathways project is a commitment in the federal-Alberta implementation agreement. We repeated our analysis of Suncor’s Firebag facility, this time incorporating the additional costs and carbon-credit generation that would result from Pathways.[16] Under an MOU scenario with a minimum effective carbon credit price of C$130 per tonne and additional pipeline capacity, we estimate that also joining the Pathways project would reduce Firebag’s TIER carbon costs. Even with the cost of building and operating carbon capture infrastructure, the facility would still be more profitable in 2035, thanks to the implementation of the MOU, than it would be without it. In our estimates, the Firebag project is also slightly more profitable by taking on the Pathways costs instead of paying the full TIER costs we estimate, but the exact results would be highly dependent on the Pathway project costs. Not all oil sands facilities would be impacted in the same way by participation in Pathways. The impact on a facility’s profitability will depend on current and future emissions relative to the facility’s benchmark. Figure: Increased profitability of Suncor’s Firebag facility in 2035 following implementation of federal-Alberta MOU and Pathways Phase 1
|

Cold Lake
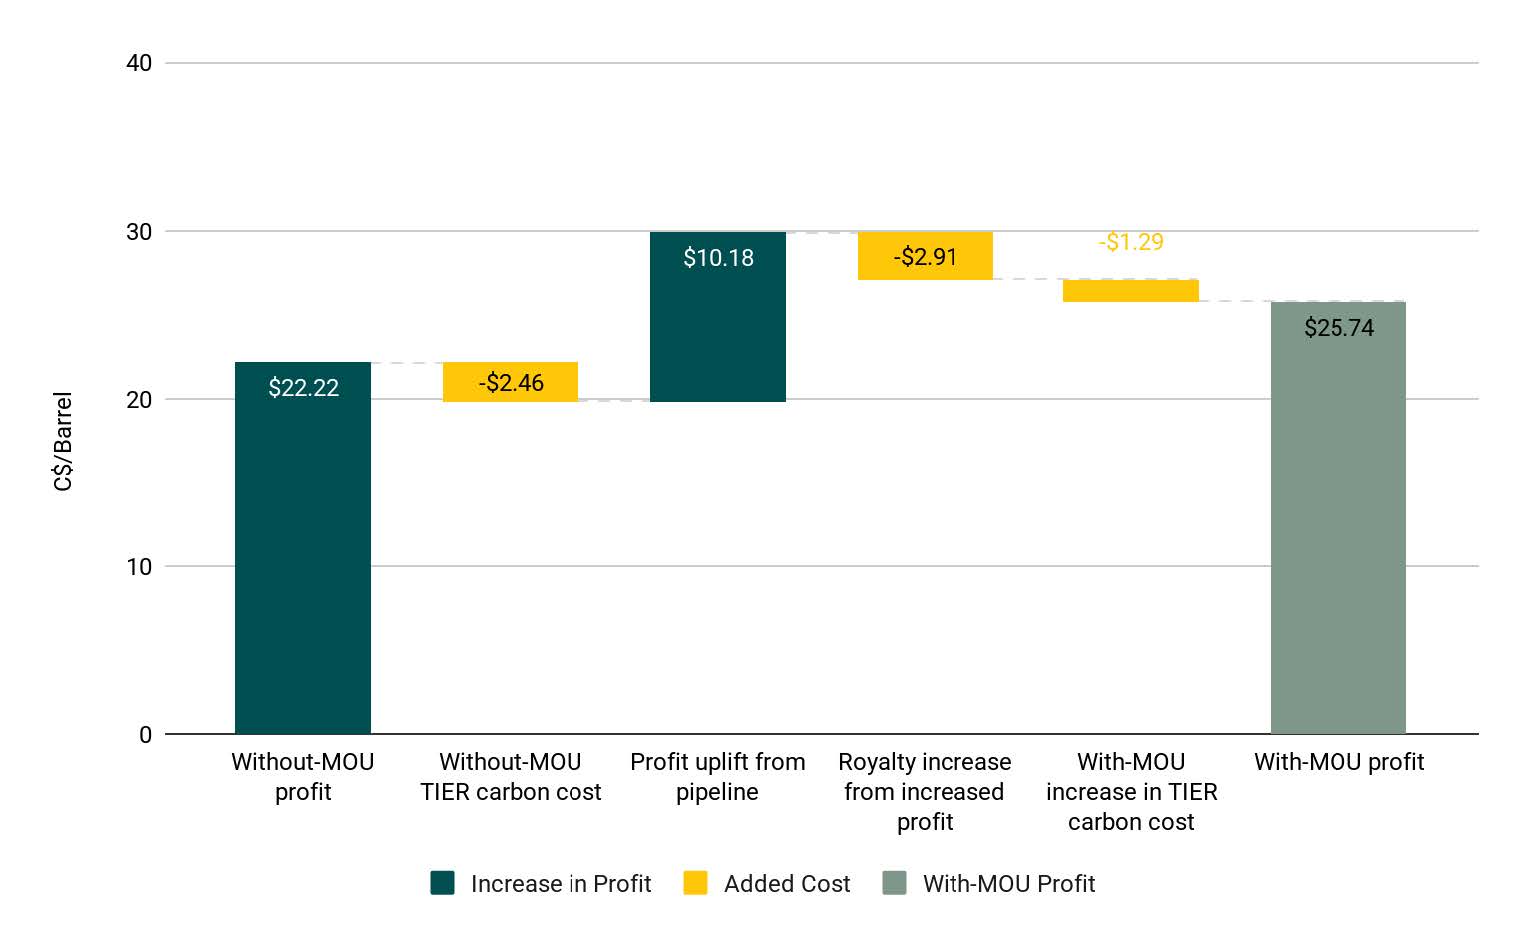
Imperial’s Cold Lake has increased its emissions intensity since its benchmark years.[17] As a result, we project that the facility will incur higher TIER costs in 2035 compared to sites that have decreased their emissions since their facility benchmark was set. This is a typical dynamic under TIER, in which sites compete against their own previous performance.
For Cold Lake in 2035, implementation of the MOU delivers a slightly more modest net improvement in profitability. Without the MOU, profit is C$19.76 per barrel, net of C$2.46 in TIER carbon costs. Tighter WCS-WTI differentials due to increased pipeline access increase profitability by 30 per cent (C$5.98 per barrel). This pricing uplift is partially eroded by a C$2.91 per barrel increase in royalties due to higher profits. Under the MOU, Cold Lake incurs the highest increase in carbon costs in our analysis — C$1.29 per barrel at a C$130 per tonne carbon credit price. This reflects the fact that Cold Lake’s emissions intensity increased since its benchmark years.
Overall, Cold Lake’s profit rises to C$25.74 per barrel, highlighting how facilities with a history of deteriorating emissions performance are still likely to be financially better off, net of a C$5 reduction in the WCS-WTI differential and higher TIER prices.
Figure 8: Increased profitability of Imperial Oil’s Cold Lake facility in 2035 following implementation of federal-Alberta MOU
Future value analysis
The above analysis shows that in 2035, the profitability uplift from improved egress more than offsets the higher cost of carbon pricing for four representative oil sands projects with varying emissions intensities and royalty periods.
The profitability benefits of new pipeline capacity are a decade away, but the costs of higher carbon pricing will be borne in the near term. Do those future benefits and present costs present a compelling investment case now?
One way to address this question is to calculate the present value of carbon costs and compare that to the present value of the reduced WCS-WTI price differentials from new pipeline capacity. We determined the total per-barrel cost of the TIER program between 2027 and our assumed 2035 in-service date of a new one-million-barrel-per-day pipeline, discounted to present.
We show two versions of the cost of TIER. The first is the total cost of the full TIER program at the carbon price outlined in the MOU. A second version shows just the incremental cost of increasing carbon prices from the current level of C$95 per tonne. We then divided that cost by the discounted future increases in per-barrel profit once the pipeline is in operation in 2035. That creates a measure of how many years of pipeline operation each project needs to recover the higher TIER costs it incurred before the pipeline entered service. This measure of how many years of higher profits are required from any new pipeline reflects the inherent uncertainty that a new pipeline may not ever result in a lower WCS-WTI differential. If it does, how long it provides that higher return is a measure of its value. The total net profit with the MOU in place (the last column of Table 1) is the net present value of the increased annual profits from 2035 to 2050 if the pipeline provides continuous improvement in pricing over this period, minus the net present value of the incremental TIER costs above C$95 per tonne between 2027 and 2035.
We used the same assumptions about TIER costs as in the analysis above. We also calculated the discounted total net additional profit after 15 years, assuming the WCS-WTI differential remains at US$13 instead of US$18, and that production and prices remain flat between 2035 and 2050. We used a 10 per cent discount rate and the same assumptions about the TIER cost trajectory outlined above through to 2035. We assumed that emissions intensities remained flat after 2035, and that headline TIER prices remained frozen at C$145 after that date. Importantly, for these calculations of the net present value of total profit, we assume no increase in oil prices until a new pipeline becomes operational in 2035.
For projects like Christina Lake, Kearl or Firebag, the increased long-term profitability that results from new pipeline capacity pays off the increased near-term costs of a C$130 per tonne TIER credit price in approximately one year or less, and total TIER costs in one to two years. Each of these projects also sees a significant overall increase in profit assuming that WCS-WTI price differentials remain constrained for 15 years. We also assume that the Kearl facility stays in the pre-payout royalty regime for this analysis. However, it will likely move to a post-payout regime over this period, reducing the project profitability but improving the fiscal returns for Alberta (as we discuss further below).
This one-year payback could materialize in a number of ways. Even if an increase in pipeline capacity to the U.S. lowers transport costs, a new pipeline to the West Coast offers egress diversification that could support producer profits in the event that exports to the U.S. are in any way constrained. The optionality value of a new pipeline to the Pacific Ocean underpins the economic return potential of the MOU framework.
Unlike the other three projects, Imperial’s Cold Lake facility faces substantial TIER costs between now and 2035, assuming it only slightly reduces emissions. That project only recovers its total 2027–2035 TIER costs after about eight years of higher profits from a new pipeline, and incremental TIER costs from the MOU in about two years.
Looking at the last column of Table 1, all projects see a substantial increase in net profits from the MOU. The net present value of their increased profits, assuming 15 years of lower WCS-WTI differentials, is substantially larger than the net present value of increased TIER costs under the MOU. The Christina Lake and Firebag projects both see an increase of around C$2.6 billion in the net present value of their profits. Kearl’s profits, assuming it stayed under the pre-payout royalty framework, would increase by a net present value of C$4.6 billion. For Cold Lake, the net present value of increased profits is C$1.3 billion.
Table 1: Net present value (NPV) of near-term TIER costs and long-term increased profitability
|
Project |
Total TIER cost, 2027 to 2035, NPV (C$ million) |
Total TIER cost in 2035 (C$/barrel) |
MOU TIER cost increase, NPV (C$ million) |
Post-MOU increased profit per barrel |
Annual production in 2035 (million barrels) |
Annual profit increase, 2035 through 2050 (C$ million) |
Net profit, 2027 to 2050, NPV (C$ million) |
|
Christina Lake |
$240 |
$0.83 |
$63 |
$6.72 |
111 |
$747 |
$2,662 |
|
Kearl |
$349 |
$1.01 |
$92 |
$9.56 |
133 |
$1,274 |
$4,559 |
|
Firebag |
$481 |
$1.39 |
$120 |
$6.54 |
112 |
$730 |
$2,546 |
|
Cold Lake |
$989 |
$3.84 |
$232 |
$5.98 |
69 |
$411 |
$1,268 |
|
Four project total |
$2,060 |
$1.52 |
$507 |
$7.44 |
425 |
$3,162 |
$11,034 |
Note: Per barrel amounts are production weighted-totals.
An additional consideration for the province of Alberta is the increased future value of royalties. Table 2 (below) shows the increase in per-barrel royalties as a result of the implementation of the MOU, and the increase in total royalties paid between 2035 and 2050. We assume that 2035 production levels remain flat through 2050.
All projects see a significant increase in total royalties paid to the province. Given their current royalty status, these four projects combined would pay roughly C$950 million more in royalties to the province if the WCS-WTI differential is reduced by US$5 per barrel. The net present value of the increase in royalties from these four projects from 2035 to 2050 is approximately C$3.2 billion to C$4.6 billion.[18] The companies that own the projects would likely also pay more in provincial and federal corporate income taxes, though this is outside the scope of our project-level analysis.
Table 2: Royalty increase from increased profitability, 2027–2050
|
Project |
Total royalty increase, 2035–2050 (C$/barrel) |
Increased annual royalties, 2035–2050 (C$ million) |
Royalty increase, 2035–2050, NPV (C$ million) |
|
Christina Lake |
$3.31 |
$368 |
$1,312 |
|
Kearl |
$0.55 |
$73 |
$233 |
|
Firebag |
$3.22 |
$360 |
$1,254 |
|
Cold Lake |
$2.27 |
$156 |
$456 |
|
Four project total |
$2.25 |
$957 |
$3,254 |
Note: Per barrel amounts are production-weighted totals.
CONCLUSION
Analysis shows that the profitability gains from securing new pipeline capacity — which significantly reduces the WCS-WTI price differential — outweigh the increased compliance costs associated with strengthening Alberta’s TIER carbon market to achieve a market price of C$130 per tonne by 2035. Even for high-emission oil sands facilities, increased market access is the dominant factor, translating into a potential net profit increase that strongly supports the grand bargain articulated in the federal-Alberta MOU. An aggressive path to decarbonization can be paired with, and financially supported by, strategic growth in market access for the oil sands sector.
-
* Benjamin Dachis is Vice President of Research and Outreach at Clean Prosperity. An economist with nearly 20 years of public policy experience, he specializes in energy, infrastructure, transportation, housing, labour, and regulatory policy. He previously spent 15 years at the C.D. Howe Institute and holds economics degrees from the University of Toronto and the London School of Economics.
Chloe McElhone is a Research Manager at Clean Prosperity specializing in Canadian carbon market policy. She previously advised industrial emitters on carbon pricing compliance and holds graduate degrees in sustainability management and environmental economics.
Rory Johnston is founder of Commodity Context.
1 Ross Linden-Fraser & Dale Beugin, “Why Industrial Carbon Pricing Costs the Oil Sands Less Than a Timbit per Barrel” (11 March 2026), online (blog): <440megatonnes.ca/insight/why-industrial-carbon-pricing-costs-oil-sands-less-than-a-timbit-per-barrel>.
-
2 Carbon cost estimates are dependent on the future design of the TIER system, including benchmark tightening and carbon price trajectories beyond 2026. Our facility-specific, 2035-horizon findings are consistent with estimates from other organizations (ibid), which assume the current federal headline price trajectory and a 2030 timeframe. These carbon cost estimates were modelled prior to the release of the May 2026 Implementation Agreement for the Canada-Alberta Memorandum of Understanding.
-
3 Alberta Central, “Year One of TMX: Increased Export Diversification, Disappearing Oil Discount, and C$13bn in Extra Revenues” (6 August 2025), online: <albertacentral.com/intelligence-centre/economic-news/year-one-of-tmx-increased-export-diversification-disappearing-oil-discount-and-c13bn-in-extra-revenues>.
-
4 Emissions are determined through rearranging the formula specified in the Government of Alberta’s oilsands database (ibid) of Cogen Adjusted Emissions = Emissions – Cogen Emissions + Cogen Heat x 0.06299 tonnes per GJ heat.
-
5 See Government of Alberta, “Alberta’s Greenhouse Gas Emissions Reduction Performance” (9 January 2026), online: <alberta.ca/albertas-greenhouse-gas-emissions-reduction-performance> (33 per cent of Alberta’s total emissions).
-
6 We estimate two additional data points for 2013 to 2015 necessary for development of facility-specific benchmarks.
1. We determine emissions from the heat used in cogeneration through the multiplication of the heat generated by the cogeneration unit in GJ by the heat intensity value of 0.06299 tCO2e/GJ. Imported and exported heat are additional variables, assumed as zero in the absence of data. The forecast for cogen-adjusted emissions is calculated based on each year’s forecasted cogen-adjusted emissions intensity and production, and the forecast for total site emissions is calculated based on each year’s forecasted cogen data.
2. We also accommodate emissions from the electricity used through the multiplication of the electricity generated on-site by the electricity high-performance benchmark for the baseline year (0.37 tCO2e/MWh in 2022 and earlier). Imported and exported electricity are additional variables, assumed as zero in the absence of data.
See section 8.2.4 of the Standard for Developing Benchmarks v2.5 (ibid) for more information.
-
7 Alberta, Environment and Protected Areas, “Alberta Oil Sands Greenhouse Gas Emission Intensity Analysis” (last modified 10 January 2024), online: <open.alberta.ca/opendata/alberta-oil-sands-greenhouse-gas-emission-intensity-analysis>.
-
8 See the appendix in the original paper for more information on how this assumption affects results: (ibid).
-
9 We calculate FSBs based on formulas prescribed in the Standard for Developing Benchmarks v2.5 (supra note 6) using baseline years 2013 to 2015 (if available) or alternate years to calibrate against reported true-up obligation data for the 2023 compliance period. Actual FSBs may vary based on confidential project-level data or director-authorized departures from standard baseline years.
-
10 Find details about the assumptions used in our financial model: Benjamin Dachis & Chloe McElhone, Net Gains: How the Federal-Alberta Grand Bargain Can Increase Oil Sands Profitability (Clean Prosperity, March 2026) at 22, online (pdf): <cleanprosperity.ca/wp-content/uploads/2026/03/Net-Gains-March-2026.pdf>.
-
11 Totals in this and subsequent figures may not sum due to rounding.
-
12 Unlike the other projects we analyze here that are in the post-payout royalty phase, and can deduct TIER credit costs as an allowable cost, we assume that TIER credit costs are not deductible for Kearl during its pre-payout royalty period.
-
13 Based on Clean Prosperity modelling (supra note 10). Cost estimates are inclusive of the federal carbon capture, utilization, and storage investment tax credit, the Alberta Carbon Capture Incentive Program, and the deduction of TIER costs when calculating post-payout royalties. Costs reflect the low end of the modelled range, on the basis that the project would only participate in Pathways if the per-tonne cost of carbon capture is below the price of carbon credits. Applying the median cost value instead would also yield total profits materially equivalent to those earned without participation in Pathways. We assume that Firebag captures 24 per cent of its annual emissions (equivalent to 1.88 MtCO2 in 2035), based on its emissions-weighted share of total projected Pathways capture volume, and that all carbon credits generated are retired and/or sold in the year they are generated (not banked).
-
14 Cold Lake began as a cyclic steam stimulation project that began commercial operations in the 1980s. As reservoirs age, oil-to-steam ratios typically decline, requiring more steam per barrel to maintain production. New developments use SA-SAGD to improve efficiency.
-
15 Oil Sands Alliance, “Pathways Project” (last modified 15 June 2026), online: <oilsandsalliance.ca/pathways-project>
-
16 Royalties are calculated net of TIER costs for post-payout projects. We deduct the net present value of foregone royalties between 2027 and 2035, as a result of higher TIER costs under the MOU, in our calculation of the total increase in royalties between 2035 and 2050.
-
17 Kearl is likely to enter its post-payout royalty period in the mid-2030s. This would increase the net present value of the province’s 2035-2050 royalties by about C$1.4 billion (and reduce Imperial Oil’s profits from the project).