I. Introduction
Any time a manufacturing firm faces rising electric rates, it will evaluate the benefits of relocating to lower cost regions. However, since electricity costs for most firms are a small share of their total costs of doing business, relocation driven by rising electric rates is unlikely to make economic sense. Of course, a firm whose electric costs are a substantial portion of total costs, such as a primary smelter of aluminum, may well find it economic to relocate.
Arguably, if industrial customers relocated every time that their electric rates rose, there would be very few manufacturing firms left in regions with higher electric costs.
We investigate this issue by reviewing the variation in industrial rates across the US using a combination of primary and secondary data.
We find industrial rates vary considerably across the US and that manufacturing firms do not relocate in response to rising electric rates. We expect similar conclusions would flow from a review of Canadian data.
Our methodology is based on an approach which synthesizes information from two sources. First is a primary survey of customers based on email and phone interviews. The second is published information from secondary sources such as the Edison Electric Institute (EEI) and the Federal Energy Regulatory Commission (FERC).
We begin by displaying the variation in industrial rates across utilities in the U.S. We focus on customers with peak demands that range from 1 MW to 50 MW. Next, we identify the types of rates being offered to industrial customers by utilities. We also determine if any special rates are being offered to large industrial customers whose size exceeds 30 MW of demand. We conclude by making some observations on future trends in industrial rates.
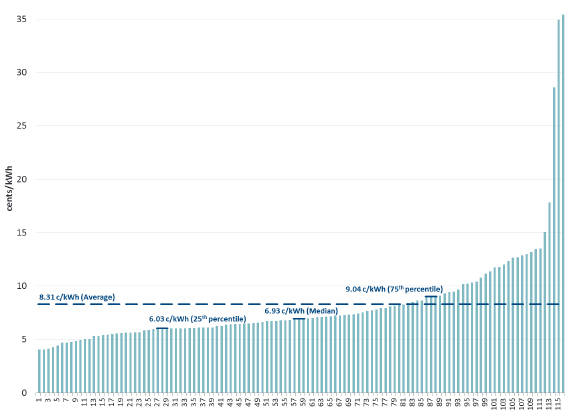
Across 116 US utilities, we find that the average all-in industrial rate is 8.31 cents/kWh. The distribution is shown in Figure 1 on the following page. The lowest rate is under 5 cents /kWh and the highest rate is around 35 cents/kWh. This wide dispersion does not support the proposition made by industrial customers that if electric rates go up, they would relocate to lower cost states. If that was literally true, no industrial customers would be found operating in higher cost areas.2 All would move to lower cost areas.
Figure 1: Distribution of Average All-in Industrial Rates
Sources and Notes: The chart reports rates for 116 U.S. utilities from the EEI Summer 2013 Rates Report for the period from July 2012-June 2013. Rates for delivery-only companies are not included. For investor-owned utilities (IOUs) with service territories across multiple states, the weighted average rate across the states is reported.
Clearly, a number of factors are involved in industrial location decisions, including cost of doing business and access of markets. And cost of doing business includes labor costs, material costs, and taxes, in addition to electricity and other energy costs.
Figure 2 presents a close-up of industrial rates by region. This figure might suggest that the south has the keenest competition for industrial customers, as shown by the tightly clustered industrial rate offerings by state. Other regions show a larger variation of industrial rates, perhaps suggestive of more captive industrial customers.
Another dimension we looked at is the distribution of rates by restructuring status of the States. We have seen that on average full retail access states have higher rates across all rate classes. Partially restructured states have rates comparable to those fully restructured. States that have abandoned restructuring have rates comparable to non-restructured states.
Another important determinant of the rates is the fuel mix of the region. Regions with low cost fuel options (i.e., coal, nuclear) generally have lower rates compared to regions with more expensive fuel options (i.e., natural gas). The South Atlantic, Mountain, Midwest and Mid-Atlantic regions have a higher share of coal and nuclear generation mix and have lower rates. New England has the highest share of natural gas generation and the highest rates. The Pacific region is less fossil fuel intensive than New England and generally has lower rates compared to New England.
Figure 2: Industrial Rates Close-Up by Region
Figure 3: Average Electricity Rates across States with Different Regulatory Structures
Figure 4: Generation Mix by Region
II. Surveyed Utilities
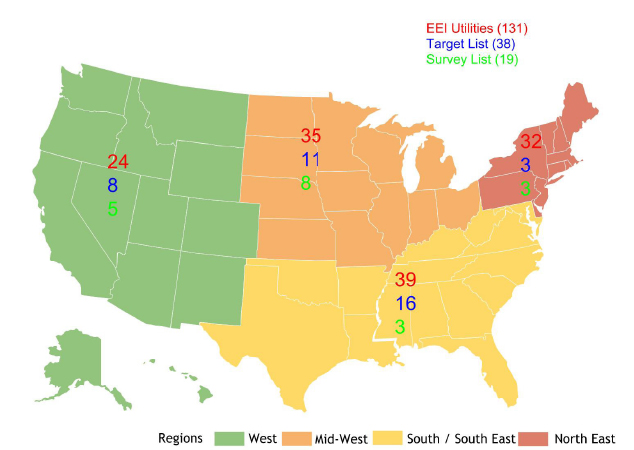
To dig deeper into the issue, we reached out to 38 utilities to carry out telephone interviews. We were able to connect with 19 utilities, located in the Western, Midwestern, and Southern regions of the US. Figure 5 represents geographical distribution of these utilities.
The average industrial customer size is 6 MW across the survey respondents and the average industrial class load factor is 63 per cent across the survey respondents.
See table 1 below.
Table 1: Summary Features of the Survey Respondents
| Attribute | Description |
| Peak Load | 2,000 MW to 22,000 MW |
| Annual Generation | 11,000 GWh to 145,000 GWh |
| Fuel Mix | Mostly coal dominant or diverse mix |
| Customer Mix | Manufacturing, metals, agriculture, data centers |
| Has Generation? | 14 own generation; 5 are delivery only |
| Restructured? | Majority of companies are based in non-restructured regions |
| Renewables? | Most have RPS requirements of 10-15 per cent in the next few years |
Figure 5: Geographical Distribution of the EEI utilities, Target List, and Survey List
The “EEI Utilities” represents the vast majority of investor owned utilities across the US.
The “Target List” covers all major regions in the US.
The “Survey List” is a subset of the target list that we successfully interviewed.
Figure 6 shows the variation in rates across 13 of the 19 survey respondents. The average all-in rate is 6.54 cents/kWh but there is considerable variation across the respondents, with the lowest rate being under 5 cents/kWh and the highest rate being around 9 cents/kWh. The two-fold variation in prices in Figure 6 is less than the five-fold variation show in Figure 2, which included several outliers, but it is still substantial.
Figure 6: Distribution of Average All-in Industrial Rates for Survey Respondents
Sources and Notes: Chart reports rates for 13 surveyed utility companies of the total 19 total surveyed companies. Rates for surveyed delivery-only companies not included in the chart. Rates from the EEI Summer 2013 Rates Report for the period from July 2012-June 2013.
Several rate types are offered by the survey respondents to their industrial customers. The rate types and the percent of utilities in the sample offering them are shown in Figure 7. Special rates for large customers are offered by only 12 per cent of survey respondents, but they are not as popular as they used to be when “economic development” rates were commonplace. Most companies reported that they do not offer negotiated rates. Companies in restructured regions are not allowed to have special negotiated rates; companies reported having special contracts before restructuring. A few survey respondents offer custom tariff rates to a very small number of large customers (typically > 20 MW). Some companies based the custom tariffs on a cost of service methodology. A couple of survey respondents mentioned having custom rates for large industrial customer such as 450 MW smelting customer and a chemical company. Several surveyed utilities offer industry-specific rates, such as for automobile manufacturers or metal smelting plants or have recently launched economic development rates to attract small/medium sized customers.
Real time pricing is offered by 18 per cent of respondents. The most popular rates are standby rates, 71 per cent, time-of-use pricing, 65 per cent, and seasonal demand and energy rates, 53 per cent.
See figure 7 below.
Figure 7: Rate Types Offered by Survey Respondents
About 50 per cent of the surveyed utilities have customers who have installed combined heat and power systems or co-generation. Of the ones that did not have such customers, the main reason given was that they had low electric rates. Of the ones who had high electric rates, a common reason that was cited was the presence of Renewable Performance Standards (more than 50 per cent of customers reported having RPS requirements).
We also asked survey respondents about historical and future trends in rates. Roughly a third of the respondents had seen rate increase in the past few years. Another third reported that rates had been stable. The last third stated that rates had changed slightly but did not disclose the direction of the change.
Looking at the future, 70 per cent of the respondents said they expected rates to rise in the next few years. The following reasons were provided: rising fuel costs, new generation coming online, changes in rate setting methodology, and the cost of complying with stringent environmental standards.
III. Conclusions
Industrial rates vary widely across the US for a variety of reasons including the fuel mix of the utility, its load shape, the cost of capacity and the cost of public purpose and environmental compliance programs. Despite the presence of higher rates in some regions and lower rates in other regions, industrial customers of different sizes and different industries are to be found in most states. Industrial relocation clearly is not just driven by the price of electricity. Many factors go into the relocation decision, including the other costs of doing business including labor costs and taxes, access to raw materials and access to markets.
Another interesting finding is that special rates for large customers are offered by only a small percentage of survey respondents and they are not as popular as they used to be when “economic development” rates were commonplace. Most utilities reported that they do not offer negotiated rates while a few utilities offer industry-specific rates, such as for automobile manufacturers or metal smelting plants. The most popular rates offered by the surveyed utilities are standby rates, time-of-use pricing, and seasonal demand and energy rates.
- The authors are principals with The Brattle Group, located in San Francisco, California and Cambridge, Massachusetts, respectively. The views in this paper are those of the authors and not of their employer. Comments can be directed to ahmad.faruqui@brattle.com.
- It could be argued that industrial customers at one time were all located in low electric rate areas. But this is unlikely to be true. There always has been considerable variation in industrial rates over time. And industrial customers have tended to locate throughout the US as opposed to just locating in regions with low electric costs.


