ABSTRACT
Fracking, a combination of hydraulic fracturing and horizontal drilling, has upturned oil markets, not so much because it has opened up new supplies, but because it is scalable. OPEC’s ability to influence prices has been undermined because reductions in supply by its members are met with reciprocal increases from shale sources. The technology has also produced a surfeit of natural gas in North America which is driving globalization of natural gas markets.
In electricity industries, scalable distributed energy resources (how could they be distributed if they were not available at small scales?) such as wind, solar and storage continue to experience rapid declines in costs. They are poised to fundamentally alter the structure and regulation of electricity industries, particularly as they place competitive pressures on incumbent utilities. These changes spawn a host of regulatory, institutional and legal issues. Among them, the potential for impaired or stranded utility assets, supply reliability, tariff evolution, and cost allocation challenges.
INTRODUCTION1
For much of the 20th century increasing scale economies were the dominant force shaping the structure of energy industries. In electricity, generating units became ever larger to take advantage of improving scale efficiencies. In oil extraction, a small number of firms with global reach, capable of developing multi-billion dollar projects, dominated world oil markets. Natural gas industries, while continental in nature, were also dominated in most places by a small number of firms. Transmission and distribution, whether of molecules or electrons, were for the most part natural monopolies. Efficiency and profitability imperatives drove energy companies to become ever larger. These centripetal forces led to industries marked by a high degree of concentration and market power, but also having increased political and regulatory influence.
In the 21st century, these trends are being reversed. Natural gas and oil can be profitably extracted by small entities employing hydraulic fracturing and horizontal drilling technologies (fracking) – the minimum efficient scale has dropped by three orders of magnitude. This has fundamentally undermined the OPEC oil cartel, as is explained further below. In electricity, generating units were historically 500 MW or more in size. Today, distributed energy resources (DERs) can, in an increasing number of locations, be effectively and competitively deployed at scales that are also three or more orders of magnitude smaller. The continued declines in costs of DERs (such as wind, solar and batteries) may, in the not too distant future, lead to a tipping point where even low volume ‘prosumers’ may seek to untether themselves from the incumbent utility.2
Scale economies are not only a critical determinant of industry structure, in particular, the number of firms, but also of its regulation. Rate regulation of natural monopolies has long since been recognized as a necessary but second-best alternative to competition. Industries where market power can be exercised relatively easily even if multiple firms are present (think electricity) have also been subject to regulatory intervention.
For purposes of this paper, scalability will mean that the activity can be undertaken at much smaller scales than previously. For example, distributed energy resources, of necessity, embody the notion that they can be deployed at small scales, else how would one distribute them?3 The main thesis of this paper is that scalability is transforming not only the structure of energy industries, but also their regulation.
HYDROCARBONS
Shale Gas
At the beginning of this century, there were significant concerns that the U.S. would begin to run out of natural gas. By 2005, prices at Henry Hub, the reference price for U.S. natural gas, were the highest in the world at $9 USD per million BTUs (see Figure 1). Prospects for increasing sales from Canada to the U.S. were promising. Plans to build liquid natural gas (LNG) import terminals on the Gulf of Mexico were in progress. Shale gas constituted a negligible portion of total U.S. production (see Figure 2). Beginning around 2006, shale supplies began to ramp up steadily, increasing to 90 billion cubic feet (bcf) per day by 2018. With average daily U.S. consumption levels presently around 75 bcf per day, U.S. LNG exports are on the rise.
The impacts of this growing supply are clearly evident in natural gas prices. In 2009, in the midst of the financial crisis, reference natural gas prices – in Europe, Japan and the U.S. – plummeted. Then a recovery began – everywhere except in the U.S. – where they have been at about one third to a half of European prices.4
Figure 1: Natural Gas Benchmarks5

The consequences for Canada were major. Natural gas exports to the U.S. declined and volumes on the TransCanada Mainline deteriorated to the point that the National Energy Board (NEB) held a lengthy proceeding to try to remedy the impacts on Mainline tariffs. Thus, fracking technology had not only a supply and price impact, but regulatory repercussions, requiring a delicate decision on the part of the NEB.6 Eventually, flows on certain eastern portions of the Mainline system were reversed to allow the import of U.S. natural gas into Canada.7
Low U.S. natural gas prices have also impacted Canadian electricity export markets. For example, Manitoba Hydro has made substantial investments on the expectation of export opportunities. However, low priced natural gas electricity generation has impacted its competitiveness in U.S. markets.8
Figure 2: U.S. Natural Gas Production9

Fracking has provided a vast new source of natural gas in North America – about 70 per cent of U.S. production of natural gas in the U.S. is from shale, and supply now exceeds demand. Historically, natural gas markets have been continental. And, although the process of supplying LNG to other continents (liquefaction, transportation and regasification) is still expensive, LNG prices at least provide an upper bound to natural gas delivered by pipeline (e.g., in Europe) particularly as LNG import terminals proliferate. As Qatar, Australia and the U.S. compete in LNG markets, along with other smaller providers, natural gas spot price differentials are beginning to narrow.
Shale Oil
The tectonic shift in oil markets followed the shift in natural gas markets by about 5 years. In 2014, prices plummeted from previous highs of well over $120 USD per barrel, to levels below $30. Multiple factors contributed to this drop, but it is arguable it was to a significant degree a consequence of the scalability of fracking because it led to fundamental changes in strategic behaviour by OPEC.
“Whereas in the past OPEC might have coordinated a supply reduction to sustain prices, its ability to do so became far more limited because shale producers (and others) could fill the gap. OPEC’s strategy was to retain market share rather than sustain higher prices. Thus, the peculiar features of the shale revolution have altered the nature of supply in critical ways. Not only are entirely new sources now technologically viable, they can be brought online in tiny increments – as noted above, the cost of a productive shale well is three orders of magnitude smaller than conventional mega-projects.”10
Figure 3: U.S. Oil Production11
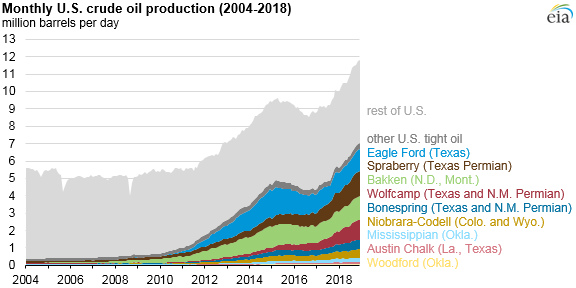
The initial speculation in 2014 was that well-endowed conventional suppliers would be able to drive out U.S. shale. That would not be the case. The drop in oil prices in 201412 was followed by a reduction in U.S. oil production in 2015 and 2016 (see Figure 3). But shale producers found ways to reduce costs, and as prices began to increase, their production rebounded. It continues to grow.13
The Effects of Scalability
Fracking for natural gas and oil has provided for a scalable response by many producers as market conditions change. Scalability of shale also reduces risks – wells do not last long – usually about two years – but capital requirements are low and lead-times short. Producers do not need to rely on long-term predictions of prices to inform their investment decisions. Furthermore, equipment used in extraction can be used in both oil and natural gas production.
More importantly, in oil markets, scalability has further limited unilateral or cartelized market power. Indeed, OPEC has over the last few years sought agreements with Russia, which is not a member, to reduce production in order to support prices. This in turn may restore a degree of market power to OPEC.14 With increases in the price of oil during the first quarter of 2019, shale production is ramping up.
Figure 4: Crude Oil Prices15 (Constant 2017 USD)

For Canadian oil producers, heavily invested in large long-term projects requiring long periods to recover capital outlays, the collapse in oil prices combined with pipeline constraints, have been devastating, emanating throughout the Alberta economy, a circumstance from which the Province has yet to recover. Efforts are being made to mitigate the pipeline bottlenecks by expanding the use of another scalable technology – rail transportation of oil. The Canadian dollar – which is highly correlated with world oil prices – has also been strongly impacted by the shale revolution (see Figure 5).
Figure 5: Oil Prices in USD (blue) vs CAD/US Exchange Rate (orange)16

One is inclined to ask: why did the shale revolution take place, first in natural gas, then in oil? Several factors were critical – declining U.S. natural gas supplies and concomitant increasing prices, as well as high and increasing oil prices.17 The development of the technology was incremental, with increasing efficiency and cost reductions occurring over time. But from a regulatory standpoint, it is unlikely that it would have occurred had it not been for the deregulatory trends that began in the late 1970s, and spread to natural gas markets.
ELECTRICITY INDUSTRIES
Economies – Past, Present and Future
In the past, electricity industries have been characterized by strong economies of scale in generation, and extreme economies of scale in ‘wires’ (natural monopolies in transmission and distribution). As deregulation spread to electricity industries, beginning in the 1990s, the wires segments (transmission and distribution) which remained fully regulated, were, in many jurisdictions, unbundled from generation in order to expose the latter to competition.18
Current electricity industry trends are characterized by decentralization, digitization and decarbonization (the “three d’s”). Decarbonization policies are driving technological innovations that alter ‘minimum efficient scale’ in generation. (Think 800+ MW coal generator vs. 2 MW wind or 5 kW roof-top solar.) Digitization is facilitating integration of distributed energy resources and decentralization of wires (think microgrids).
Electricity industries have displayed other important ‘economies’:
- economies of density – distributors with a more densely distributed customer base usually enjoyed lower unit costs;19
- economies of contiguity – service of contiguous, or at least not too widely separated areas, also had beneficial impacts on costs;20
- vertical economies of scope which were sometimes used to justify vertical integration of generation, transmission and distribution;21
- horizontal economies of scope which underlie the multi-utility model (e.g., natural gas and electricity) contributed to lower administration costs.22
Decentralization and digitization are driving two ‘new’ economies:
- vertical scope economies at a much more granular level between ‘wires’ and DERs are growing, blurring the line between certain ‘natural monopoly’ segments of the industry, and those that are potentially competitive;
- the ‘network effect’ – the ability of individual participants on the grid to interact with others for purposes of coordination and exchange.
Declining Costs of Key Scalable Technologies
The costs of emerging technologies which are transforming electricity industries have been dropping at a rapid pace. Figure 6 provides an especially salient picture: over the period 2008 to 2015, costs of wind generation dropped by 41 per cent; photovoltaics dropped more than 50 per cent; and battery costs by 73 per cent.23
Figure 6: Cost Reductions in Key Technologies 24

Non-dispatchable generation such as on-shore wind is priced at about 6 U.S. cents/kWh for new installations. Solar photovoltaic is also at 6 U.S. cents/kWh. Combined cycle natural gas electricity generation for new installations costs about 5 U.S. cents/kWh if used at high capacity, and conventional combustion turbine generation is at about 9 U.S. cents/kWh if used at low capacity, as is often the case.25 Furthermore, in the U.S., over the period 2014 to 2018 costs of onshore wind have dropped in real terms by about 40 per cent, solar photovoltaic by 60 per cent and solar thermal by 40 per cent.26 Capacity markets have been proliferating, driven by the need to maintain reliability as intermittent resources expand.
Storage
Storage is seen as the linchpin to overcoming two of the most pressing challenges: the intermittency of wind and solar generation, and decarbonization of the transportation sector. There are initiatives along multiple lines, but chemical battery storage that is scalable and cost effective would substantially overcome both hurdles. Although lithium-ion battery prices continue to drop dramatically, it may be that a very different technology will ultimately provide us with grid-scale storage because design parameters are much less restrictive than in transportation applications. Weight is not a factor for stationary batteries, and operating temperatures can be much higher. However, breakthrough technologies, especially from a cost point of view, are yet to be discovered.27
Distributed generation combined with storage creates the possibility of electricity self-sufficiency for small consuming units or groups of units, for example, on a microgrid.28 At the same time, distributed resources can increase the resiliency of a system and ensure supply at institutions such as subways and hospitals where uninterrupted service is essential.29
Regulatory Challenges Associated With Storage
In electricity industries, assets are often used for multiple purposes, providing different types of services, or fulfilling different needs. This is yet another instance of the ‘economies of scope’ concept, where in this case, ‘multi-products’ can occur at various stages of production.
Electricity storage has this feature as it can be used for a variety of purposes, fulfilling various functions. This ‘multi-product output’ feature creates an ambiguity when attempting to allocate costs to the different uses. There is typically no formulaic approach leading to a unique allocation of costs based on ‘cost causality’.
Grid-based energy storage has numerous applications and can confer a wide variety of benefits.
- In wholesale energy markets it can convey financial benefits to the facilities owner through energy arbitrage; it can produce system benefits through avoided or deferred investment in additional generation capacity; it can provide ancillary services.
- It can produce transmission benefits through avoided or deferred investment in transmission capacity or upgrades.
- At the distribution level, it can mitigate or relieve congestion; increase resiliency; delay or avoid investment in distribution capacity; and provide ancillary services.
- At the customer level, it can improve reliability and provide backup for critical loads (such as hospitals, transportation systems, communications and information systems).
- Energy storage becomes more important as intermittent renewables provide an increasing share of energy. It may also directly mitigate the carbon issue to the extent that it displaces gas-fired generation.
- In the transportation sector, storage is critical for electric vehicle charging given high load requirements, especially for rapid charging stations.
Given this wide range of activities and benefits cost allocation is a delicate matter. The relevant literature (which relies on cooperative game theory) leads to a range of cost allocations which are economically efficient, equitable and apprehensible within policy and regulatory settings. A common sense approach involves comparing the total costs of providing each output or service on a ‘stand-alone’ basis, to the costs of producing the outputs jointly. The savings achieved by the latter are then divided up.
When applied in settings where all firm outputs are sold in price-regulated markets, these cost allocation principles may be contested on grounds of equity. For example, cost allocation across customer groups is often a contentious matter in regulatory proceedings. However, if some outputs are sold in regulated markets, and others are not, there is an additional complication arising out of the risks that the utility might have the incentive to cross-subsidize competitive market activities by regulated activities. Misallocations can result in claims of anti-competitive behaviour, potentially undermining competition.
In some cases, the associated benefits can be quantified with a reasonable degree of accuracy, in others they are more difficult to calibrate, thereby complicating the allocation of costs to cost centers. But perhaps the most important benefits, and most difficult to quantify, are beneficial spillover effects and innovation that occurs as a result of ‘learning by doing’.
Additional Considerations
Regulation of electricity industries has undergone considerable changes in recent decades. In many jurisdictions, incentive regulation replaced cost-of-service or rate-of-return regulation. Efforts to introduce competitive forces into the generation segment led to vertical separation or unbundling. Different implementations evolved into models with widely varying degrees of competition in generation, in some cases relying heavily on long-term supply contracts. Thus, even in the absence of radical technological changes, effective regulation has been a constantly moving target.
The rapidity with which costs of DERs are declining suggests that we are potentially on the cusp of disruptive changes, requiring the rethinking of utility business models and regulatory approaches. Disruptive innovation in regulated settings has precedent, most prominently in the telecom and information industries.
The increasing role of DERs creates new risks for incumbent utilities, as such resources can reduce sales. This, in turn may require revisiting allowable rates of return earned by utilities, and changes in rate design. For example, it may be that rates that are less dependent on volumetric measures would be more appropriate as sufficient wires capacity needs to be present to meet peak local demand even if total volume declines.
Ownership of storage by distributors and whether these costs can be included in rate base portends to be another contentious issue. Ownership by distributors reduces the incentives for distributors to build wires infrastructure30 rather than relying on storage installations. On the other hand, ‘level playing field’ issues also arise.
Given environmental decarbonization objectives, the question arises how best to promote and fund innovation. A case can be made that innovation should be funded at least in part by ratepayers and/or taxpayers. The reasoning is that the spillover effects of innovation can vastly exceed the direct benefits arising from avoided T&D investment and arbitrage opportunities. Furthermore, innovation which does not lead to intellectual property, reduces the incentives for experimentation by utilities. In short, utilities that are responsible to their shareholders do not have the built-in incentives to produce socially optimal levels of expenditure on innovation.31
One of the complications which arises is the blurring of lines between DERs and grids. Distributing utilities are well positioned to take advantage of economies of scope which arise from operating the distribution wires and owning and dispatching storage units. They can identify, deploy and integrate storage in locations which best defer wires investments, reduce congestion and improve reliability. In addition, distributors have access to facilities that can site storage installations as well as to rights-of-way.
Furthermore, there can be considerable variation in outage rates and reliability within a distribution system. Some locations may experience especially high outage rates, for example, as a result of the relative age of facilities or a high incidence of congestion. This is arguably inequitable from a customer perspective. Battery storage can serve to mitigate such inequities.
CONCLUDING COMMENTS
Natural gas and oil industries have been profoundly transformed in little more than a decade by advances in fracking. This highly scalable technology has undermined OPEC market power and allowed the U.S. to become a leading world producer of hydrocarbons. ‘Peak-oil’ has been turned on its head: the question is no longer ‘When will supply reach its peak?”, but “When will world demand for oil begin to decline?”
The rapid decline in costs of scalable electricity technologies – DERs – is also transforming electricity industries. Along the way, DERs have spawned a host of challenges – regulatory, institutional and legal – among them:
- There are risks that some assets belonging to incumbent utilities will become impaired as a result of under-utilization, or even stranded.32 These include generation and wires assets. Who should absorb the costs?
- Tariff redesign may be indicated as prosumer generation increases, but connection to the grid remains necessary. This may lead to greater emphasis on the fixed relative to the volumetric component of tariffs.
- Storage facilities, which we have focused on, raise a range of cost allocation issues given their multiple uses. These are further complicated as some activities are traditionally regulated (such as substitution of storage for wires investments), others presumably unregulated (such as energy arbitrage).
- The essentiality of reliability in the presence of intermittent supplies has contributed to the proliferation of capacity markets, which involve highly complex administrative processes and vigilant market oversight. Rule design can create risks of regulatory arbitrage, which may not be foreseen.
There is a continuing need for redesign and evolution of regulatory institutions and supporting legislation. One tends to worry about market failure, but regulatory failure is also a threat. Under-regulation can result in spectacular failures (think Enron, the 2008 financial crisis and Facebook privacy issues). Over-regulation can lead to failures that are more subtle but can have large and far-reaching implications, most importantly stifling innovation and productivity growth, but also unnecessarily increasing costs.
* Professor Adonis Yatchew, Economics Department, University of Toronto, Editor-in-Chief The Energy Journal.
- This paper draws liberally on past papers, presentations and materials from undergraduate and graduate courses taught by the author, online: <https://www.economics.utoronto.ca/yatchew>.
- The term ‘prosumer’ (producer-cum-consumer), was coined in the 1980s by futurist Alvin Toffler. It is not clear that Toffler anticipated either small scale self-generation of electricity, or 3-d printing. The latter is paving the way to a ‘self-manufacturing’ revolution.
- But, one can also ask the obverse question – whether a technology can be scaled up. The proliferation of intermittent or non-dispatchable resources has led to concerns about the impacts on the electricity system when the share of such resources increases and crosses certain thresholds. Furthermore, a technology such as solar may be difficult to scale up in countries with high population density, such as China and India.
- The very high LNG prices in Japan from 2011 to 2014 were a consequence of the Fukushima disaster which forced Japan to increase its imports of natural gas.
- “BP Statistical Review of World Energy 2018” (2018) 67 BP Statistical Review of World Energy, online: <https://www.bp.com/en/global/corporate/energy-economics/statistical-review-of-world-energy/downloads.html>.
- For an early analysis of this decision, see Gordon Kaiser, “The TransCanada Mainline Decision: Toward Hybrid Regulation” (2013) 1 Energy Regulation Quarterly, online: <https://www.energyregulationquarterly.ca/case-comments/the-transcanada-mainline-decision-toward-hybrid-regulation#sthash.Xr66T926.dpbs>.
- Efforts to convert come of TransCanada’s underutilized natural gas pipelines to oil – the ‘Energy East’ proposal – were unsuccessful and subsequently abandoned.
- See, e.g., Adonis Yachew, Before the Public Utilities Board of Manitoba, Manitoba Hydro General Rate Application, 2017/18 and 2018/19, Expert Testimony of Adonis Yatchew, November 15, 2017 (2017), online: <http://www.pubmanitoba.ca/v1/proceedings-decisions/appl-current/pubs/2017per cent 20mhper cent 20gra/iecper cent 20reports/yatchewper cent 20report.pdf>.
- Jack Perrin & Emily Geary, “EIA adds new play production data to shale gas and tight oil reports” U.S. Energy Information Administration (19 February 2019), online: <https://www.eia.gov/todayinenergy/detail.php?id=38372>.
- D. Dimitropoulos & A. Yatchew, “Discerning Trends in Commodity Prices” (paper delivered at a workshop on “Commodity Super-Cycles” at the Bank of Canada, (April 2015), “Discerning Trends in Commodity Prices” (2017) 22:3 Macroeconomic Dynamics 683-701.
- Source: see supra note 9.
- In a remarkably prescient observation, at least two years prior to the 2014 decline when prices for WTI were about $120 USD, a physics professor at Berkeley, asked “How high can the price of oil go? In the long term, it should not be able to stay above the synfuel price of $60 per barrel…There is another upcoming source of liquid fuel that could drive the price of oil lower, and that could even challenge the profitability of synfuel. It’s called shale oil.” Richard A. Mueller, Energy for Future Presidents: The Science Behind the Headlines (New York: W. W. Norton & Company, 2012) at 108.
- See, e.g., Emily Geary, “U.S. crude oil production grew 17 per cent in 2018, surpassing the previous record in 1970”, U.S. Energy Information Administration (9 April 2019), online: <https://www.eia.gov/todayinenergy/detail.php?id=38992&src=email>.
- In addition to undermining the market power of OPEC, there have been other major geopolitical consequences, for example, on Russia and Venezuela. The potential for increased LNG exports to Europe may, in time, reduce the influence of Russian gas on European natural gas prices. Future geopolitical ramifications are subject to wide speculation. Suffice it to say that non-democracies have produced the dominant share of world oil production, receiving trillions of dollars of oil revenues in excess of the costs of production.
- Supra note 5. The major increases in oil prices in the 1970s were a consequence of OPEC actions. The opening of the North Sea fields drove prices down, beginning in the mid-1980s. Prices again rose in the 21st century, with a major plunge as a result of the 2008-2009 financial crisis.
- West Texas Intermediate oil crude prices.
- Economists sometimes quip that the best cure for high prices is…high prices. This is a lesson also relevant in competitive electricity markets, such as energy-only markets.
- Incentive regulation also began to take hold, in an effort to drive productivity growth in regulated monopolies.
- Customer density is a common variable in estimation of the costs of distributing electricity. See, e.g., D. Dimitropoulos and A. Yatchew, “Is Productivity Growth in Electricity Distribution Negative? An Empirical Analysis Using Ontario Data”, (2017) 38:2 The Energy Journal 175-200.
- For example, the Ontario Energy Board, in RP-2003-0044, concluded that the emergence of ‘embedded distributors’ within the boundaries of existing distributors, would lead to “diseconomies of contiguity”, online: <https://www.oeb.ca/documents/cases/RP-2003-0044_Transcripts/decisionwithper cent 20reasons_270204.pdf>.
- Other industries were also often vertically integrated – for example, telephone companies provided both local and long-distance services, essentially due to economies of scope. Indeed, the legal and regulatory battles that ensued in the 1980s which eventually separated ‘local loop’ from long distance service revolved around economies of scope arguments.
- For example, Utilities Kingston provides electricity and natural gas to the city of Kingston, Ontario in addition to various other services.
- LED bulb costs have declined by a stunning 94 per cent.
- Source: Revolution…Now, The Future Arrives for Five Clean Energy Technologies – 2016 Update (September 2016), online: <https://www.energy.gov/sites/prod/files/2017/05/f34/Revolution%20Now%202016%20Report_2.pdf>. “Notes: Land based wind costs are derived from levelized cost of energy from representative wind sites…Distributed PV cost is average residential installed cost…Utility-Scale PV cost is the median installed cost…Modeled battery costs are at high-volume production of battery systems, derived from DOE/UIS Advanced Battery Consortium PHEV Battery development projects. LED bulb costs are cost per lumen for A-type bulbs…”
- These are Levelized Cost of Energy (LCOE) numbers which embed assumptions about depreciation lifetimes, cost of fuel and, as indicated, utilization capacity factors. US, U.S. Energy Information Administration, Levelized Cost and Levelized Avoided Cost of New Generation Resources in the Annual Energy Outlook 2019 (February 2019) Table 1b, at 8, online: <https://www.eia.gov/outlooks/aeo/pdf/electricity_generation.pdf>. Combined heat and power systems, because of their high efficiency, have the potential for increasing market penetration. See US, U.S. Department of Energy, Combined Heat and Power Technical Potential in the United States (March 2016), online: <https://www.energy.gov/sites/prod/files/2016/04/f30/CHPper cent 20Technicalper cent 20Potentialper cent 20Studyper cent 203-31-2016per cent 20Final.pdf>; also US, U.S. Energy Information Administration, Many industries use combined heat and power to improve energy efficiency (27 July 2016), online: <https://www.eia.gov/todayinenergy/detail.php?id=27252>.
- Author’s calculations based on ibid, Table 1, at 6.
- A leading researcher in this area is Professor Donald Sadoway at MIT who focusses on liquid-metal batteries. The elements that he works with are much more abundant than those used in lithium-ion batteries, and therefore much cheaper. In his presentations, he often says “If you want batteries to be dirt-cheap, you need to make them out of dirt”.
- Though not a focal point in this paper, microgrids can contribute important resiliency benefits. In downtown Tokyo, there is an area called Ropponggi Hills, which provides its own electricity, heat, and cooling. Despite the devastating earthquake and tsunami in March 2011, and the Fukushima disaster, service in Ropponggi Hills was uninterrupted. The area also contributed to service restoration in other areas. Its Sendai microgrid was able to serve most of the nearby university campus as well as critical facilities such as a hospital. Distributed energy systems and microgrids also provided some advantages after Hurricane Sandy. Imagine what Puerto Rico would have looked like after Hurricane Maria had there been a significant number of micro-grids which could operate as islands, or link to neighbours or to the larger grid. See Utility of the Future. An MIT Energy Initiative response to an industry in transition, MIT Energy Initiative, December 2016 at 67, online: <http://energy.mit.edu/publication/utility-future-report>.
- Such facilities traditionally rely upon on-site backup generation, another type of distributed energy resource.
- This is akin to the Averch-Johnson effect.
- See, e.g., James M. Coyne, Robert C. Yardley, Jessalyn Pryciak with comments by Adonis Yatchew, “Should Ratepayers Fund Innovation?” (2018) 6:3 Energy Regulation Quarterly, online: <https://www.energyregulationquarterly.ca/articles/should-ratepayers-fund-innovation#sthash.7MjneaUp.dpbs>.
- Recall the impacts on the MainLine of U.S. shale gas.